Survivorship Bias in Backtesting
If your historical universe contains only instruments that still trade today, your backtest has implicitly given itself perfect foresight about which companies would survive — information no live trader ever has. This survivorship bias systematically inflates backtest returns and produces strategies that look good historically but fail in live trading where delistings, bankruptcies, and acquisitions are real and frequent.
Module 5 — Backtesting Rigorously: Backtesting Pitfalls (pillar) · Walk-Forward Analysis · Deflated Sharpe Ratio · CPCV · Survivorship Bias ← you are here · Look-Ahead Bias
What Is Survivorship Bias?
Consider a researcher testing an equity strategy on US stocks using data downloaded today. The data provider returns price history for all stocks currently listed on major exchanges. The strategy is a cross-sectional value screen: buy the 10 percent of stocks with the lowest price-to-book ratios each quarter.
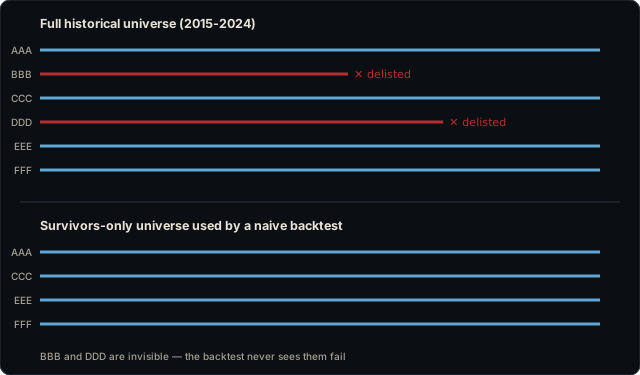
The problem: the current list of stocks did not exist in its current form in 2010. In 2010, thousands of companies were listed that have since been delisted due to bankruptcy, acquisition, going-private transactions, or regulatory action. Many of these companies had low price-to-book ratios — precisely because they were in distress and heading toward zero. A backtest using today's universe would have avoided all of these value traps. A real-money strategy in 2010 could not have avoided them, because they appeared in the data and looked like value opportunities.
The result is that the backtest tests a “universe of survivors” — companies that were good enough to still be listed at the research date — and assigns returns to all of them retroactively. Companies that would have dragged down returns are invisible. The backtest measures a universe that never existed at any point during the tested period.
The Magnitude of the Bias
The inflation depends on strategy type, universe, and historical period:
- Buy-and-hold equity strategies: Academic estimates range from 0.5 to 2 percentage points of annual return inflation for broad US equity universes. This is a floor estimate; high-delisting periods (2000–2002, 2008–2009) produce larger biases.
- Value and distressed screens: Higher inflation, because low-price-to-book and other value signals positively select distressed companies. The companies most likely to delist are overrepresented in value screens. A bias-free value backtest looks meaningfully different from a survivorship-biased one on a 20-year history.
- Small-cap universes: Higher delisting rates than large-cap universes, so the bias is larger. Small-cap annualized returns in backtest literature are frequently cited as overstated by 2–4 percentage points due to survivorship.
- Momentum strategies: Moderate inflation. Momentum strategies typically hold recent winners, which are less likely to be delisting candidates, so the bias is smaller than for value screens — but not zero.
The bias is structural and systematic. It does not average out with more data; it compounds with each additional year of testing on a survivor-biased universe.
Data Provider Survivorship-Bias Status
| Provider | Bias-free? | Granularity | Notes |
|---|---|---|---|
| Norgate Data | Yes — explicitly | EOD only | The only retail-accessible source built explicitly survivorship-bias-free. US, AUS, CAN equities + ~100 futures/FX. |
| Polygon / Massive | Partial (includes delisted tickers) | Tick through EOD | Has delisted history; requires manual universe construction to eliminate bias. Not turn-key bias-free. |
| Tiingo | No [UNVERIFIED] | EOD + IEX intraday | Good for current listings; bias-free status unconfirmed. |
| yfinance | No | Daily (limited intraday) | Unofficial Yahoo scraper; delisted stocks removed from Yahoo within months. Unsuitable for rigorous equity research. |
| Alpha Vantage | No | Intraday through daily | Current listings only; no delisted history for equity universe construction. |
| Databento | Partial (raw exchange feeds) | Tick / MBO | Raw venue data includes all tickers present at the venue on each date. Requires universe reconstruction from exchange membership files. |
How to Test Your Dataset for Survivorship Bias
The definitive test is point-in-time constituent comparison: find a list of all companies in your target universe as of the strategy start date — not today's list, but the historical list. Historical S&P 500 constituent lists are available from Compustat (via academic access) and some data vendors. If the companies in your backtest universe differ materially from the historical constituent list (specifically if delisted companies are missing), your dataset is survivorship-biased.
A simpler heuristic for self-assessment: pick a company that was listed in your universe's historical period but has since delisted — a bankruptcy from five years ago is a good example. Can your data provider return a price history for that company? If not, its database is not survivorship-bias-free.
For strategies that do not require the full historical universe — for instance, a trend-following strategy applied to a fixed set of futures contracts — survivorship bias is less critical. Futures markets rarely “delist” in the same way equities do, though contract rollovers and market shutdowns do occur. The bias matters most for strategies selecting from a large, changing equity universe.
The Fix: Point-in-Time Universe Construction
The remedy is to build your universe from a data source that tracks which instruments were listed on each historical date — a point-in-time universe. Norgate Data provides this explicitly for US equities. For Polygon/Massive, the raw ticker history can be cross-referenced with exchange delisting dates to reconstruct a point-in-time universe, but this requires additional engineering. Academic databases (Compustat, CRSP) provide the most rigorous point-in-time constituent data, though access requires institutional affiliation.
Frequently Asked Questions
- What is survivorship bias in backtesting?
- Survivorship bias in backtesting occurs when the historical universe used for testing contains only instruments that still exist today — survivors — and excludes instruments that were delisted, went bankrupt, or were acquired. Because companies that fail typically perform poorly before failure, excluding them from the backtest inflates average returns. A cross-sectional equity strategy tested on the current S&P 500 constituent list treats 2010 as if the researcher knew in 2010 which companies would survive to 2026, which they could not have known. The result is a positive return bias that disappears in live trading.
- How much does survivorship bias inflate backtest returns?
- The inflation magnitude depends on strategy type, universe, and time period. Academic studies on US equities have estimated survivorship bias at 0.5 to 2 percentage points of annual return for buy-and-hold equity strategies. For higher-turnover strategies that rebalance frequently, or for strategies that select from broad small-cap universes where delisting rates are higher, the bias can be larger. The effect is largest for strategies that select the worst-performing or highest-risk stocks, since those are the most likely to delist. Any cross-sectional ranking strategy — value screens, distressed stock strategies, low-price filters — is especially sensitive.
- Which data providers give survivorship-bias-free historical data?
- Norgate Data is the only listed retail-accessible provider explicitly built survivorship-bias-free, covering US, Australian, and Canadian equities plus approximately 100 futures and FX series. It provides end-of-day data only. Polygon.io (now Massive.com) includes delisted tickers in its historical database, making it possible to construct a survivorship-bias-free universe, though it requires more careful data wrangling than Norgate. Most other retail-accessible providers — yfinance, Alpha Vantage, Tiingo, Finnhub — do not reliably include delisted symbols and are not suitable for rigorous equity backtesting without a separate source of delisting events.
- Does yfinance include delisted stocks?
- No. yfinance wraps Yahoo Finance's API, which provides only current listings and a limited window of historical data for each. Delisted stocks are typically removed from Yahoo's database within months of delisting. A strategy backtest using yfinance therefore contains only companies that survived to the research date. This makes yfinance unsuitable for rigorous cross-sectional equity research even though it is widely used for learning and experimentation. For survivorship-bias-free equity research, use Norgate Data (EOD, explicit bias-free coverage) or Polygon/Massive (includes delisted tickers in historical database) with manual universe construction.
- How can I test whether my backtest dataset has survivorship bias?
- The clearest test is to compare the historical universe in your dataset to a point-in-time list of all constituents at the same date. If your 2010 universe contains only companies that are still listed in 2026, it is survivor-biased. A practical check for index-following strategies: pull the list of S&P 500 constituents as of your strategy start date (historical constituent lists are available from Compustat and similar) and compare to what your data provider actually has for that date. A simpler heuristic: if your data provider cannot give you the price history of a company that delisted three years ago (e.g., a bankruptcy in 2023), its historical database is not survivorship-bias-free.
Drill survivorship bias, data-provider selection, and backtest validity with AlgoDrill's spaced-repetition flashcards.
Start Flashcards → View Reading List →