Walk-Forward Analysis
Walk-forward analysis is the practitioner standard for validating trading strategies. Rather than optimizing on the full historical dataset and measuring performance on the same data, WFA rolls a series of in-sample optimization windows forward through time, testing each set of optimized parameters on the immediately following out-of-sample period — exactly as the strategy would be used in practice.
Module 5 — Backtesting Rigorously: Backtesting Pitfalls (pillar) · Walk-Forward Analysis ← you are here · Deflated Sharpe Ratio · CPCV · Survivorship Bias · Look-Ahead Bias
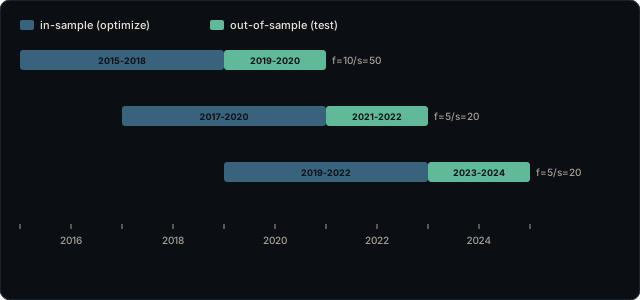
What Is Walk-Forward Analysis?
Walk-forward analysis (WFA) was systematized by Robert Pardo in The Evaluation and Optimization of Trading Strategies (Wiley, 2008). The method proceeds in three steps, repeated for each window position:
- Define an in-sample (IS) window. Select a fixed-length window of historical data, e.g., 756 trading days.
- Optimize on IS. Run the strategy with all parameter combinations on that window. Record the best-performing parameter set.
- Test on out-of-sample (OOS). Apply the best IS parameters, without any re-fitting, to the immediately following window (e.g., 252 days). Record OOS performance.
Then step the window forward by the OOS length and repeat. After consuming the full dataset, you have a sequence of OOS performance records — one per window — that collectively represent what the strategy would have achieved if deployed in real time. The aggregate OOS result is the diagnostic; IS performance is irrelevant because it was used only for optimization.
Why Simple Holdout Validation Is Fragile
The alternative to WFA is a single in-sample/out-of-sample split: optimize on the first 70 percent of history, test on the last 30 percent. This approach has two fundamental weaknesses for financial data.
First, financial returns are not IID (independent and identically distributed). They exhibit serial correlation, volatility clustering, fat tails, and regime changes. The single holdout period may be drawn from a market regime very different from the optimization period — a strategy optimized in 2010–2019 might be tested on 2020–2025, a period of three distinct regimes (pre-COVID, COVID volatility spike, post-COVID inflation). A regime mismatch makes OOS performance uninterpretable: poor OOS could reflect an overfit strategy or simply a regime the strategy was not designed for.
Second, if the holdout is consulted more than once — to check whether a modification improved things, or to re-optimize a parameter that performed poorly — it is no longer out-of-sample. It has been converted into additional in-sample data through use. Walk-forward analysis sidesteps this by construction: each OOS window is seen exactly once, after the IS optimization that precedes it is complete, and it is never revisited for parameter decisions.
Walk-Forward Analysis vs Simple Holdout vs CPCV
| Method | OOS periods | Serial correlation | IS/OOS contamination risk | Typical use |
|---|---|---|---|---|
| Simple holdout | 1 window | Ignored | High if holdout is re-used | Fragile; peeked-at holdout becomes in-sample |
| Walk-Forward Analysis | Many rolling windows | Partially handled by temporal ordering | Low — each OOS window seen once | Practitioner standard for strategy validation |
| CPCV | Many combinatorial paths | Fully handled (purge + embargo) | Structural prevention via purging | Statistical gold standard; PBO computation |
Choosing IS and OOS Window Lengths
The IS window must be long enough for the optimizer to produce stable parameter estimates. A commonly cited rule: the IS window should contain at least 30 observations per free parameter being optimized. A strategy with three parameters (entry threshold, exit multiplier, lookback period) would need at least 90 observations in its IS window — but in practice, IS windows of 1–3 years are the norm for daily strategies, because parameter stability over short windows is poor even when the 30×k rule is technically satisfied.
The OOS window should be long enough to contain statistically meaningful performance — a 20-day OOS window produces mostly noise — but short enough that the market regime remains roughly consistent within it. IS:OOS ratios of 3:1 to 5:1 are commonly cited (Pardo uses 4:1 as a default in his worked examples). For daily strategies, a 252-day OOS window (one trading year) with a 756–1,008-day IS window (three to four years) is a reasonable baseline.
Worked Example: Rolling WFA on a Moving-Average Crossover
Consider a 200-day / 50-day exponential moving-average crossover strategy. The parameters being optimized are the two lookback periods. A walk-forward test over 10 years of daily data (2,520 bars) with a 756-day IS window and 252-day OOS window produces approximately seven OOS periods (with 252-day steps). For each IS window, we might test lookback pairs ranging from (10, 100) to (5, 200) in steps of 5 days. The best-performing pair for each IS window is applied to the subsequent OOS window. The seven OOS results, concatenated, form the WFA equity curve — what the strategy would have produced in real time, without any re-fitting beyond the annual re-optimization.
A strategy that is genuinely robust will show similar performance in IS and OOS — the IS/OOS Sharpe ratio gap will be small. A strategy that is overfit will show a wide gap: high IS Sharpe, poor OOS Sharpe. The WFA makes this gap visible explicitly.
Platform Support
Walk-forward analysis is available natively in NinjaTrader (Strategy Analyzer, Walk-Forward tab) and is the standard validation protocol in institutional quant shops. In Python, WFA can be implemented with any event-driven or vectorized framework by looping the IS window, running the optimizer, applying the best parameters to the OOS window, and recording results. López de Prado's Advances in Financial Machine Learning (Wiley 2018) describes WFA in the context of financial ML and presents CPCV as the generalization that addresses WFA's limitations for ML-heavy strategies with serial-correlated labels.
Frequently Asked Questions
- What is walk-forward analysis in algorithmic trading?
- Walk-forward analysis (WFA), developed by Robert Pardo, is a validation method that mimics how a strategy would be deployed in practice. The dataset is divided into alternating in-sample (IS) and out-of-sample (OOS) windows. Within each IS window, the strategy's parameters are optimized. The optimized parameters are then applied, without re-fitting, to the immediately following OOS window. Results are recorded for each OOS window. The process rolls forward until the full dataset is consumed, producing many OOS performance records. The aggregated OOS result is the key measure; the IS result is irrelevant.
- Why is a single holdout validation weak for financial time series?
- Financial returns are not independent and identically distributed. They exhibit serial correlation, volatility clustering, and regime changes. A single holdout period may be drawn from a different regime than the in-sample period — a momentum strategy optimized in a trending market will look poor in a mean-reverting holdout, not because the strategy is wrong, but because the holdout is unrepresentative. Walk-forward analysis addresses this by creating many OOS windows across different market conditions, producing a more regime-representative estimate of OOS performance. It also prevents IS/OOS contamination: each OOS window is seen exactly once, after the IS optimization is complete.
- How do I choose IS and OOS window lengths for walk-forward analysis?
- The IS window must be long enough to stably optimize the strategy's parameters. A rule of thumb: the IS window should have at least 30 times the number of free parameters in observations. The OOS window should be long enough to contain statistically meaningful performance, but short enough that the market regime remains roughly consistent within it. Common IS:OOS ratios range from 3:1 to 5:1. For daily strategies, a 252-day OOS window with a 756-day IS window is a reasonable starting point. Shorter OOS windows mean more OOS periods and more statistical confidence in the aggregate, but each individual window is more noise-dominated.
- What is the difference between walk-forward analysis and walk-forward optimization?
- Walk-forward optimization refers specifically to the parameter search within each IS window — finding the optimal parameter set over that window. Walk-forward analysis is the broader validation framework that includes both the optimization step and the subsequent OOS application and recording. In common usage the terms are interchangeable. The distinction matters only when the optimization itself is discussed in isolation. NinjaTrader's Strategy Analyzer labels its implementation as walk-forward optimization and produces both IS and OOS performance reports for each rolling window.
- When should I use CPCV instead of walk-forward analysis?
- Combinatorial Purged Cross-Validation (CPCV) is the statistically stronger method when the strategy has many free parameters, when the sample is short, or when the goal is to obtain a full distribution of OOS performance rather than a single aggregate metric. Walk-forward analysis is faster to implement, conceptually simpler, and the practitioner standard understood by most quant shops. Use WFA as the baseline validation for any strategy before live trading. Use CPCV when you need the Probability of Backtest Overfitting (PBO), when regulatory or institutional audiences require it, or when WFA gives ambiguous results on a strategy with many parameters.
Drill walk-forward analysis mechanics, IS/OOS window selection, and validation comparisons with AlgoDrill's spaced-repetition flashcards.
Start Flashcards → View Reading List →