Trend Following: Donchian, MA Crossover, and the Skew Profile
Trend-following strategies profit from sustained directional moves by accepting a low win rate in exchange for positive skew: a few large winners offset many small losses. The rules are simple and fully codifiable — no discretionary judgment required. The challenge is surviving the long losing periods in choppy markets with enough conviction to stay in the strategy when a major trend eventually arrives.
Related strategy archetypes:
- Trend Following ← you are here
- Mean Reversion Strategy — the opposite archetype
- Statistical Arbitrage — market-neutral spread reversion
- Time-Series Momentum Research — academic evidence
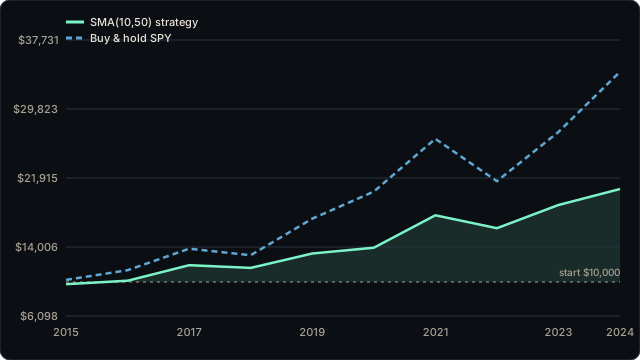
Three Rule-Codifiable Trend Entry Signals
1. Donchian Channel Breakout
Enter long when price closes at a new N-day high. Enter short (or exit long) when price closes at a new N-day low. The economic logic: a new N-day high means all buyers over the past N days are profitable, which historically correlates with continued momentum. Common N values are 20, 50, and 100 days. The Donchian rule is entirely lookback-defined, requires no pattern recognition, and produces a clear entry signal. Exits use a symmetric rule or a shorter trailing channel (e.g., enter on 50-day high, exit on 20-day low).
2. Moving Average Crossover
Enter long when the fast MA crosses above the slow MA (golden cross); enter short or exit when the fast MA crosses below (death cross). Common parameter pairs: 50/200-day (long-horizon), 10/50-day (medium-horizon). The crossover rule trades trend with a built-in filter: the slow MA smooths noise, so short-lived reversals do not trigger entries. The tradeoff: the signal lags price action. By the time the fast MA crosses above the slow MA, a meaningful portion of the trend has already developed. This lag reduces per-trade profit but improves signal quality by filtering out more reversals.
3. Time-Series Momentum (TSMOM)
Enter long if the past-K-month return of the instrument is positive; enter short if it is negative. The canonical specification (Moskowitz, Ooi, Pedersen, 2012) uses K = 12 months with a 1-month skip to avoid the short-term reversal. This rule is purely return-sign-based: it requires no price levels, no moving average parameters, just the sign of the trailing return. The academic evidence for TSMOM is substantial across asset classes including equities, bonds, commodities, and currencies. See Time-Series Momentum Research for the primary literature.
The Loss-Rate vs Payoff-Skew Trade-Off
Trend-following strategies typically close only 30–45% of trades profitably. This low win rate is not a flaw — it is a design feature. The exit rule cuts losing trades quickly (limited downside per trade), while winning trades are held as long as the trend continues (potentially unlimited upside per trade). The resulting distribution is positively skewed: many small losses, occasional large gains.
From a mathematical perspective: even if the win rate is 35%, a trend-following strategy is profitable if the average winner is sufficiently larger than the average loser. A ratio of average win to average loss of 3:1 produces a positive expected value even at a 35% win rate: 0.35 × 3 − 0.65 × 1 = 1.05 − 0.65 = +0.40 per unit risked.
This is the direct opposite of mean-reversion strategies, which have high win rates (60–75%) but negative skew — most trades win small, but the rare large loss when the mean-reversion fails can be substantial.
Capacity Evidence from Managed Futures
Trend-following has one of the largest documented capacity profiles of any systematic strategy. Managed futures funds (CTAs) have operated trend-following strategies across futures markets in equities, bonds, currencies, and commodities for decades. Clenow's Following the Trend documents diversified trend-following returns across 30+ years of data, showing that the strategy survives across multiple market regimes because of its diversification across asset classes: a choppy equity environment often coincides with trending bond or commodity markets. Multi-billion-dollar CTA funds continue to operate because liquidity in futures markets is deep enough that the strategy is not self-defeating at institutional scale. This stands in contrast to high-frequency or equity-market-neutral strategies, where capacity is tightly constrained by market liquidity and speed requirements.
When Trend Following Fails
Trend following underperforms during choppy, mean-reverting markets. When prices oscillate without sustained directional moves, trend entries fire and then immediately reverse, producing repeated small losses. In the aftermath of financial crises, momentum strategies have historically suffered severe multi-year drawdowns — the crisis itself may generate a large trending move, but the subsequent volatile recovery produces extensive whipsaws. The defense is diversification across uncorrelated markets so that choppy conditions in one asset class do not coincide universally with choppy conditions in all others.
Backtesting rigor: Trend-following strategies evaluated on a single market will show survivorship bias and regime-selection bias. Backtest across multiple markets, multiple regimes (trending, ranging, crisis), and use walk-forward analysis rather than single in-sample optimization. A single-market trend backtest over a period of sustained trends proves nothing about live performance in a choppy regime. See Backtesting Pitfalls for the full failure taxonomy.
Frequently Asked Questions
- What is trend following in algorithmic trading?
- Trend following is a systematic strategy that bets sustained directional price moves will continue. It enters long when a defined momentum signal fires and exits (or reverses) when the signal disappears. The strategy has no directional bias — it can be long or short depending on the trend. Entries are triggered by breakouts, moving average crossovers, or positive time-series momentum; exits are triggered by signal reversal or a trailing stop. The economic rationale is that markets exhibit momentum at medium-term horizons (weeks to months) due to slow information diffusion, investor underreaction, and trending macro fundamentals.
- What is the loss rate and payoff skew of trend following?
- Trend-following strategies typically have a win rate well below 50% — often 30-45% of trades are profitable. The positive edge comes from positive skew: losing trades are small and cut quickly by the exit rule, while winning trades can be many multiples of the initial risk when a sustained trend develops. The expected value of a trend-following trade is positive despite the low win rate because the average winner is 3-5x the average loser. This is the opposite return distribution of mean-reversion strategies, which have high win rates but negative skew. Trend following profits come from a few large moves; long periods of small losses in choppy markets are the cost.
- What is a Donchian channel breakout rule?
- A Donchian channel breakout rule enters long when price closes at a new N-day high, and short (or exits) when price closes at a new N-day low. It is one of the oldest and most studied trend entry signals: a new N-day high means every trader who bought in the past N days is profitable, which historically correlates with continued upward momentum. The channel width (N) is the primary parameter; common values are 20, 50, and 100 days. The rule is fully codifiable and avoids any subjective pattern recognition. At exit, a symmetric rule (N-day low) or a shorter trailing channel (e.g., 10-day low after a 50-day high entry) is commonly used.
- When does trend following fail?
- Trend following fails in choppy, mean-reverting markets. When prices oscillate around a flat mean rather than trending directionally, momentum entries trigger and then immediately reverse, producing a sequence of small losses. After major financial crises, trend-following strategies can fail for extended periods: the initial crisis move may be captured, but the subsequent volatile recovery whipsaws positions repeatedly. Momentum strategies have historically suffered severe drawdowns in the period following financial crises. The typical defense is diversification across many uncorrelated markets (futures across asset classes), so that a choppy period in equities may coincide with trends in bonds or commodities.
Drill trend-following rules, skew mechanics, and strategy regime trade-offs with AlgoDrill's spaced-repetition flashcards.
Start Strategy Flashcards → Mean Reversion Strategy →